Wednesday 24 May 2017

PROTIEN (AMENDED)


DEPARTMENT OF BIOLOGY

FACULTY OF SCIENCE & MATHEMATICS
UNIVERSITI PENDIDIKAN SULTAN IDRIS

SBK3013
PRINCIPLE IN BIOCHEMISTRY

EXPERIMENT 5: PROTIEN (AMENDED)


NAME
MATRIC NO.
MUHAMMAD FARIS BIN ISMAIL SAZEMI
D20141067089
MAYURIE PHUTHARANT A/P SURIN
D20141067078
NUR AFIQAH SYAHMINA BT MOHD KAMAL
D20141067091

GROUP: A
LECTURER’S NAME: DR. ROSMILAH MISNAN
INSTRUCTOR NAME: NUR ATIEKAH BT AZAHARI


INTRODUCTION

Determining the exact quantity of proteins in a solution is very often necessary in the biochemical practice. There are many ways to measure protein concentration. In chromogenic methods, the absorbance of a coloured product formed by the protein and an organic molecule is measured. Protein concentration can also be determined from the protein’s UV absorbance. However, these methods may give different results for different proteins of the same concentration. Different methods also can yield different results for the same protein. There is no absolute photometric protein concentration assay. All methods have advantages and disadvantages and we must choose among them by taking the following aspects into consideration: specificity, sensitivity, the measurable range of concentration, the accuracy, the nature of the protein to be examined, the presence of materials interfering with the measurement, and the time required for the measurement.
The first test is to determine the protein concentration by using the Biuret assay method. Molecules with two or more peptide bonds react with Cu2+ ions in alkaline solution and form a purple complex. Nitrogen atoms of the peptide bonds form a coordination bond with the metal ion. The quantity of the complexes formed is proportional to the number of peptide bonds. In practice, the determination of protein concentration is done using a calibration curve created using samples of known concentration. The protein treated with biuret reagent is measured at 540 nm after the purple product is formed. The advantages of the method include that only few materials (e.g. Tris and amino acid buffers) interfere with it, it can be done in a short time and does not depend on the amino acid composition of the protein. Its disadvantages are its low sensitivity and that it requires at least 1 mg of protein.
Second test to determine the protein concentration is by using the Lowry assay method. The advantage of this method is Lowry assay is sensitive to low concentrations of protein. The major disadvantage of the Lowry method is the narrow pH range within which it is accurate. A variety of compounds will interfere with the Lowry procedure. These include some amino acid derivatives, certain buffers, drugs, lipids, sugars, salts, nucleic acids and sulphydryl reagents. The ammonium ions, zwitter ionic buffers, nonionic buffers and thiol compounds may also interfere with the Lowry reaction. These substances should be removed or diluted before running Lowry assays.


MATERIAL

·         Protein standard
·         Biuret reagent
·         Lowry reagent
·         Sample: fish, beef, chicken, peanut, green bean, soybean, red bean and dal bean

PROCEDURE

1.      Preparation of protein standard
1.      Solution of gelatin at 1, 2,3,4,5 and 6 mg/mL in water from the gelatin stock solution (10 mg/mL) for biuret assay was prepared.
2.      Solution of gelatin at 0.1, 0.2, 0.3, 0.4, 0.5 and 0.6 mg/mL in water from the gelatin stock solution (1 mg/mL) for Lowry method was prepared.

2.      Preparation of test samples
a.       Animal protein
1.      10 g of protein sample was weighted
2.      Macerated into smaller size
3.      Phosphate Buffer saline at 1:10 ratio was blended
4.      Sample was filtered by kitchen filter
5.      The supernatant was collected
6.      Sample was filtered again using Whatman filter No 1
7.      The supernatant was collected
b.      Plant protein
1.      10 g of protein sample was weighted
2.      The sample was crushed and grinded into fine paste or powder using mortar and pestle.
3.      The powder was dissolved in Phosphate Buffer saline at 1:10 ratio
4.      Sample was filtered by kitchen filter
5.      The supernatant was collected
6.      Sample was filtered again using Whatman filter No 1
7.      The supernatant was collected


3.      Protein assay
a.       Biuret assay
1.      0.5 mL of each protein was mixed with 2.50 mL of biuret reagent
2.      The absorbance of the samples at 540 nm after 10 minutes was measured
3.      The standard curved was plotted
4.      The protein content of the test sample was estimated using the standard curve.
b.      Lowry assay
1.      0.25 mL of each protein was mixed with 2.5 mL of  Lowry reagent 1
2.      The mixture was incubated at room temperature for 10 minutes.
3.      0.25 mL of Lowry reagent 2 was added and mixed immediately
4.      The mixture was incubated at room temperature for 30 minutes.
5.      The absorbance of the samples at 750 nm was measured.
6.      The standard curved was plotted
7.      The protein content of the test sample was estimated using the standard curve.

RESULT

Protein Standard

1.      Biuret


Protein Number
B1
0.439
B2
0.509
B3
0.512
B4
0.542
B5
0.769
B6
0.995


2.      Lowry


Protein Number
L1
0.132
L2
0.106
L3
0.406
L4
0.256
L5
0.115
L6
0.081


Protein Number for Other Sample

Sample
Biuret
Lowry
Beef
0.488
0.944
Fish
1.020
1.320
Braise Fish
1.138
0.406
Chicken
0.552
1.328
Soybean
0.447
0.377
Red bean
0.645
0.926
Peanut
0.476
1.219
Dal bean
0.746
0.214
Green bean
0.983
1.945


DISCUSSION

In Biuret assay we combine protein samples with Biuret Reagent which contains copper ions in a basic solution. The copper ions will complex with the amide groups in the proteins to create a blue colour that will be measured using a spectrophotometer. The amount of blue colour that forms is directly proportional to the quantity of protein in the sample. In order to determine the actual concentration of protein in the unknown sample it is necessary to graph the standard curve. Our standard graph is shown as above.

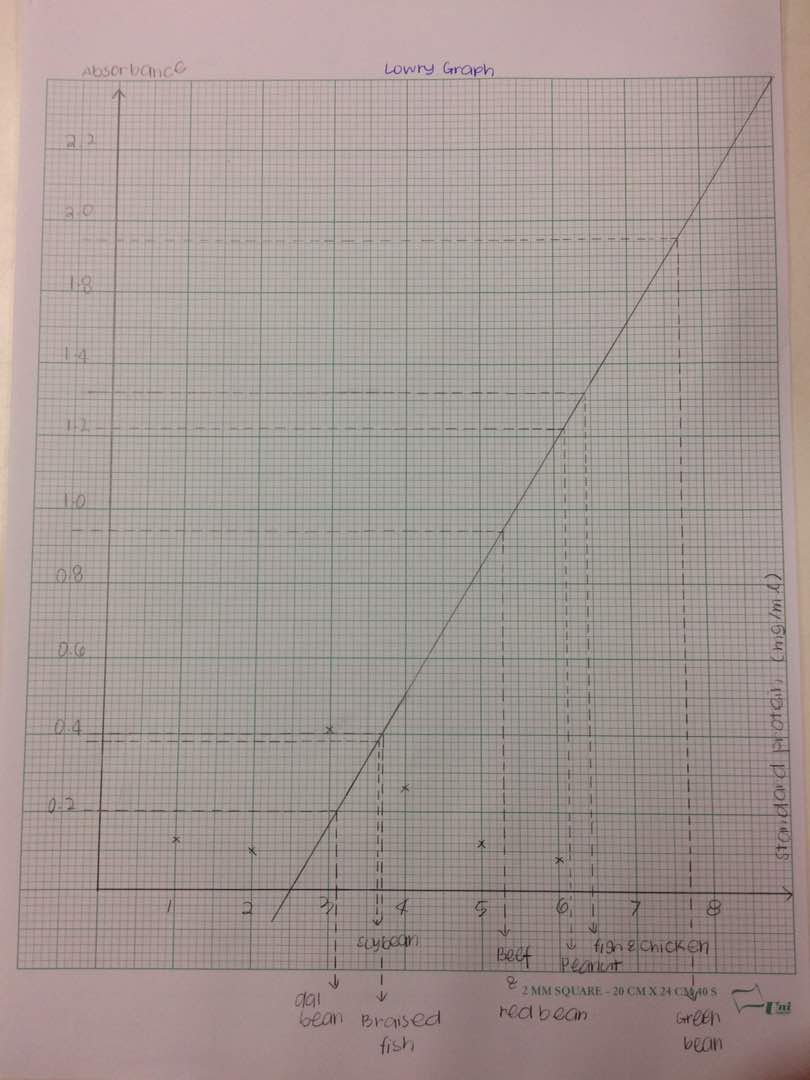
The Lowry assay combines the reactions of copper ions with the peptide bonds under alkaline conditions (the Biuret test) with the oxidation of aromatic protein residues. The Lowry method is used with protein concentrations of 0.01–1.0 mg/Ml. It is based on the reaction of Cu+, produced by the oxidation of peptide bonds, with Folin–Ciocalteu reagent. The concentration of the reduced Folin reagent is measured by absorbance at 750 nm. As a result, the total concentration of protein in the sample can be deduced from the concentration of Trp and Tyr residues that reduce the Folin–Ciocalteu reagent.

In our experiment, the results for Biuret test showed that braise fish has the highest protein number of 1.138 followed by fish, green bean, dal bean, red bean, chicken, beef, peanut and soybean. In the other hand, Lowry test showed that green bean has the highest protein number of 1.945 followed by chicken, fish, peanut, beef, red bean, braise fish, soybean and dal bean.

There are few errors occur in our experiment. First and foremost, the measuring cylinder that have been used to measure volume each samples are not cleansed thoroughly, and this may due to some particles left can alter the measurement of each sample. Furthermore, the absorbance of samples are measured less than 10 minutes. This may cause the reading of the absorbance are not accurate.

QUESTION AND ANSWER

1.      3 alternative methods of determining protein concentration are

i)                    By using UV absorbance. Protein concentrations can be determined directly by ultraviolet spectroscopy because of the presence of tyrosine and tryptophan which absorb at 280 nm. Furthermore, this method include high sensitivity so valuable protein samples can be recovered.

ii)                  BCA Protein Assay. Bicinchoninic acid (BCA) reacts with cuprous ions to generate purple colour at 562 nm. Cuprous ions are produced by the reduction of cupric ions by proteins in alkaline solutions. It is compatible with a large number of extraneous materials found in protein preparations.

iii)                Dye-binding method. Dye Coomassie Blue G-250 is dissolved in an acidic solution causing it to absorb at 465 nm (reddish brown). When the dye (negatively charged) binds to the positively charged protein molecule the absorbance undergoes a shift to 595 nm (blue). This shift in absorption maximum is proportional to protein concentration over a broad range.

2.      Appropriate blank is a reference measurement of the transmitted light as a function of wavelengths is stored in memory. When a measurement of a sample is made, the intensity of light that has been transmitted through the sample is recorded. Appropriate blank is needed to calibrate the spectrophotometer. This is because it may be some other particles or substances presence in the sample.

CONCLUSION

In conclusion, for the Biuret test, braise fish has the highest protein number that is 1.138 meanwhile for the Lowry test, green beans shows the highest protein number that is 1.945 when compared to the other sources of protein.

REFERENCES

N. A. Khan and K. N. Singh. 2014. Laboratory manual of biochemistry. New Delhi: Daya
             Pub. House


Moran, Laurence A., Horton, H. Robert, Scrimegeour, K. G. and Perry, Marc. 2014. Principle
               in Biochemistry. 5th ed. Upper Saddle River, NJ: Prentice Hall. 

REFLECTION PROTEIN (AMENDED)

REFLECTION PROTEIN (AMENDED)

MUHAMMAD FARIS BIN ISMAIL SAZEMI      D20141067089

This is the last experiment that we had done. In this experiment, we learnt two methods to determine the concentration of protein that is Lowry and Biuret method. We have 8 samples animal and plant protein to be tested, since it will take a greater amount of time if we do all the 8 samples alone, then we divide each group to take a samples and then we take the result and compile. By doing this way, it will take much shorter time. We get the peanut samples and the others get chicken, fish beef, soybean, red bean, green bean, and hazelnut samples.
During conducting the experiment, we does not neglect all the safety precautions, when we want to take any chemical, we will make sure that all the group member wear the gloves. This is to make sure that no bad incident will happen. Since that is the last experiment, surely I will miss to do the biochemistry laboratory work again.

MAYURIE PHUTHARANT A/P SURIN    D20141067078

Good day everyone, this the last laboratory experiment for this subject. I am so thrilled and glad that we are able to finish the tasks within the time given. Since there are a lot samples to be tested, we divided our workloads equally. In this experiment, the methods used to determine protein concentration are Lowry and Biuret Test. Actually, there are few methods more to determine the concentration of protein, but in this experiment we just focus on Lowry and Biuret Test. There are few errors occur that make our result doesn’t turn out well. We have try our best to minimize the error but due to some carelessness, the value that we get is quite different from the other group. We learn from our mistake, and we will try our best next time.

NUR AFIQAH SYAHMINA BT MOHD KAMAL            D20141067091

Assalamualaikum and hello everyone, today is the last lab for biochemistry. For today experiment, we doing a protein test for several different type of food. This lab have many sample that need to be test, so we divided the sample where each group get one sample. After the experiment, we compile the result from each group and it can save our time. Our group get peanut to been test. We need to conduct two test which is biuret and Lowry test to look at the protein contain in each food. Thank to my group member that help make the experiment to moving smooth and we manage to finish it on the time. As I say before this is our lab for this subject, I really want to say thank you to our instructor, Miss Atiekah that help us during this semester for conducting the experiment. I also want to say thank you and sorry to my group member who has gone through many thing with me during the proses doing the experiment and lab report. I hope we can meet again in other class.
Thank you.


Tuesday 2 May 2017

LIPID


DEPARTMENT OF BIOLOGY

FACULTY OF SCIENCE & MATHEMATICS
UNIVERSITI PENDIDIKAN SULTAN IDRIS

SBK3013
PRINCIPLE IN BIOCHEMISTRY

EXPERIMENT 4: LIPID 


NAME
MATRIC NO.
MUHAMMAD FARIS BIN ISMAIL SAZEMI
D20141067089
MAYURIE PHUTHARANT A/P SURIN
D20141067078
NUR AFIQAH SYAHMINA BT MOHD KAMAL
D20141067091

GROUP: A
LECTURER’S NAME: DR. ROSMILAH MISNAN
INSTRUCTOR NAME: NUR ATIEKAH BT AZAHARI


INTRODUCTION

Today experiment is about lipid and we gone look into the saponification of triglycerides. Lipids are molecules that contain hydrocarbons and make up the building blocks of the structure and function of living cells. For examples, fats, oils, waxes, certain vitamins, hormone and most of the non-protein membrane of cells. Besides that, lipids are a large and diverse group of naturally occurring organic compounds that are related by their solubility in non-polar organic solvents and general insolubility in water. The tri-esters of fatty acids with glycerol (1, 2,3-trihydroxypropane) compose the class of lipids known as fats and oils. These triglycerides are found in both plants and animals, and compose one of the major food groups of our diet. Triglycerides that are solid or semisolid at room temperature are classified as fats, and occur predominantly in animals. Those triglycerides that are liquid are called oils and originate chiefly in plants, although triglycerides from fish are also largely oils. The process of saponification, by heating a triglyceride in aqueous potassium hydroxide (KOH) the fatty acyl esters can be cleaved off (hydrolysis) leaving behind glycerol and the potassium salt of the fatty acid. So, the triglycerides that contain high fatty acids number will have a lower saponification number that triglycerides with low fatty acids number.

MATERIAL

Triglyceride sample (sunflower oil, corn oil, palm oil, margarine and butter)
             Solvent ( 1:1 ethanol/ether)
      0.5 M KOH/ ethanol solution
            Phenolphtalein
            0.5 M HCL

PROCEDURE

1.      1.0 g of the sample triglyceride is placed to a small beaker and 4 ml of solvent is dissolved (solvent is 1:1 ethanol / ether).
2.      The dissolved triglycerides is transfer to a small distillation flask and the beaker is washed twice with 1 ml of solvent (1:1 ethanol/ether) to collect all residual material. The "wash" is added to the distillation flask.
3.      25 ml of 0.5M KOH /ethanol solution is added
4.      The exact volume of mixture is measured.
5.      A second system as a "Control" (or reference) was set up with 25 ml of the 0.5M KOH/ethanol solution plus 2 ml of 1:1 ethanol/ether solvent for a final volume identical to the test sample solution.
6.      A reflux condenser is set up on each flask and place heater for 30 minutes. The hydrolysis will occur during this period.


7.      Figure shows hydrolysis process
8.      The flasks is allowed to cool. Three drops of indicator solution was added (phenolphthalein, 10 g/L) to both flasks and titrated with 0.5M HCl solution.


9.      Figure show the titration process
10.  The saponification number for tested samples was calculated by using the given formula.
11.  The molar difference between the amount of 0.5M HCl required to neutralize the "Control" and the amount of HCl required to neutralize the test sample equals the amount of 0.5M KOH used in the saponification process.
12.  The weight (mg) of KOH used to saponify the 1 g sample was calculated. The saponification number for tested samples was calculated
13.  The final results from the other groups was obtained for each sample and a table to summarize the results was prepared.


RESULT


Sample
B (ml)
T (ml)
Saponification Number
Sunflower oil
22.2
21.0
33.7
Corn oil
23.0
22.0
28.1
Margarine
23.0
20.0
84.2
Butter
28.0
25.0
84.2
25.0
21.5
98.2
22.5
22.0
14.0
Palm oil
23.0
22.0
28.1


Saponification Number = (B-T) X M of KOH X MW KOH / Sample weight (g)


  • Saponification number: The mass of KOH in milligram (mg) that is required to saponify 1 gram of fat.
  • B = volume (ml) of 0.5 mol/l HCl consumed in the blank test (Initial volume HCl-final volume HCl)
  • T = volume (ml) of 0.5 mol/l HCl consumed in the sample test (Initial volume HCl-final volume HCl)
  • Molecular weight of KOH (MW KOH)= 56.11 g/mol
  • Molar of KOH (M) = 0.5 mol/L
  • Sample weight (g) = 1 g

Calculation for saponification number


Sample
B (ml)
T (ml)
Saponification Number
Sunflower oil
22.2
21.0
Saponification Number = (B-T) X M of KOH X MW KOH /
                                          Sample
 weight (g)
                                      = (22.2-21.0) x 0.5 X 56.11/1
                                      = 33.7
Corn oil
23.0
22.0
Saponification Number = (B-T) X M of KOH X MW KOH /
                                         Sample
 weight (g)
                                      = (23.2-22.0) x 0.5 X 56.11/1
                                      = 28.1
Margerine
23.0
20.0
Saponification Number = (B-T) X M of KOH X MW KOH /
                                          Sample
 weight (g)
                                      = (23.0-20.0) x 0.5 X 56.11/1
                                      = 84.2
Butter
28.0
25.0
Saponification Number = (B-T) X M of KOH X MW KOH /
                                          Sample 
weight (g)
                                      = (28.2-25.0) x 0.5 X 56.11/1
                                      = 84.2
25.0
21.5
Saponification Number = (B-T) X M of KOH X MW KOH /
                                          Sample
 weight (g)
                                      = (25.0-21.5) x 0.5 X 56.11/1
                                      = 98.2
22.5
22.0
Saponification Number = (B-T) X M of KOH X MW KOH /
                                          Sample 
weight (g)
                                       = (22.5-22.0) x 0.5 X 56.11/1
                                       = 14.0
Palm oil
23.0
22.0
Saponification Number = (B-T) X M of KOH X MW KOH /
                                          Sample 
weight (g)
                                      = (23.0-22.0) x 0.5 X 56.11/1
                                      = 28.1


DISCUSSION

In this experiment, we are able to determine the saponification number for each sample tested. Saponification value (sap) or also known as saponification number represents the number of milligrams of potassium hydroxide (KOH) required to saponify 1g of fat under the conditions specified. It measures the average molecular weight of all the fatty acids present. The smaller the molar mass of the fat, the higher the saponification value.

In this experiment we obtained that there are three different values of saponification number for butter that we get from three different groups.  There are slight different between the readings which are 84.2, 98.2 and 14.0 respectively. There are huge different between the readings due to technical errors. This might due to addition of too much phenolphthalein into the sample solution. Secondly, the readings are not taken immediately after the solution turned colorless. Butter fat is made out of a majority of short chained fatty acids, hence it should have high number of saponification value.

Margarine have higher number of saponification value which is 84.2, followed by sunflower oil sap value of 33.7, corn oil sap value of  28.1 and palm oil sap value of 28.1. Theoretically triglycerides containing long fatty acids will have a lower saponification number than triglycerides with shorter fatty acids. Low fatty acid fats like coconut oil or palm oil fat will have high saponification value. On the other hand vegetable oils like sunflower oil will have a lower saponification number. It means that, palm oil have the shorter fatty acid chain than corn oil and sunflower oil. For the palm oil and corn oil, the saponification number should higher than sunflower oil because they have shorter fatty acid chain than sunflower oil. Due to errors during experiment, the results obtained were totally different from what we expected. The amount of phenolphthalein dropped into the solution might be too much or too little hence it alters our value of amount of HCL.


CONCLUSION

From the experiment that have been conducted, substances that have the higher number of saponification is butter and the least saponification number also butter. We can say that the result is not accurate because the result from butter is from three different group and all the group get the different saponification number. We can say that there may have some mistake during the process.

REFERENCES

Zumdahl, Steven S. (2009). Chemical Principles (6th ed.). New York: Houghton Mifflin Company

Hill, J.W.; Petrucci, R.H.; McCreary, T.W.; Perry, S.S. (2005). General Chemistry (4th Ed.). Upper Saddle River, New Jersey: Pearson Prentice Hall.

Fromm, H. J.&  Hargrove, M. (2012). Essentials of Biochemistry. Pearson Education


PROTIEN (AMENDED)

DEPARTMENT OF BIOLOGY FACULTY OF SCIENCE & MATHEMATICS UNIVERSITI PENDIDIKAN SULTAN IDRIS SBK3013 PRINCIPLE IN BIOC...