Tuesday 28 March 2017

APPLICATION: MAKING pH INDICATOR


DEPARTMENT OF BIOLOGY

FACULTY OF SCIENCE & MATHEMATICS
UNIVERSITI PENDIDIKAN SULTAN IDRIS

SBK3013
PRINCIPLE IN BIOCHEMISTRY

LABORATORY PROJECT 1
APPLICATION: MAKING pH INDICATOR


NAME
MATRIC NO.
MUHAMMAD FARIS BIN ISMAIL SAZEMI
D20141067089
MAYURIE PHUTHARANT A/P SURIN
D20141067078
NUR AFIQAH SYAHMINA BT MOHD KAMAL
D20141067091

GROUP: A
LECTURER’S NAME: DR. ROSMILAH MISNAN
INSTRUCTOR NAME: NUR ATIEKAH BT AZAHARI


INTRODUCTION
pH is the measure of the concentration of hydrogen ions in a solution. In this experiment we used red cabbage and common flower which contain indicator pigment as a test paper. The extraction of those natural indicators will be used to test the presence of acid or base in the household products. The changes color depending on the pH of the solution it is mixed with. The color scale obtained were used to determine the pH of the products.

MATERIAL
·         HCl solution
·         NaOH solution
·         Acetone
·         Purple cabbage
·         Purple flower
·         Household chemical ( toothpaste, detergents, soap and conditioner)

 PROCEDURE

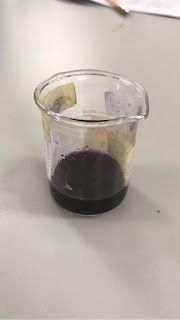
Extracting the indicator
  1. Purple cabbage was smashed up until it crushed.


  2.    10 mL of acetone was added into the purple cabbage

  3. Then extract from the purple cabbage was been filtered and the extract from the purple cabbage was collected.

     
  4. Step 1 until 3 was repeated by using Purple flower 


Testing the pH range of the indicator 

  1.  13 test tube was labelled as test tube 1 until test tube 13 and prepared for two set;
    set A and set B.
  2. Next step followed as a table below:
  3. After that, the solution in test tube set A was divided into half and transfer to the
    test tube set B


    Test tube
    Distilled water
    Acid or Base
    pH
    1
    -
    10 ml of 0.1 M HCl
    1
    2
    9 ml
    1 ml acid from test tube 1
    2
    3
    9 ml
    1 ml acid from test tube 2
    3
    4
    9 ml
    1 ml acid from test tube 3
    4
    5
    9 ml
    1 ml acid from test tube 4
    5
    6
    9 ml
    1 ml acid from test tube 5
    6
    7
    10 ml
    -
    7
    8
    9 ml
    1 ml NaOH from test tube 9
    8
    9
    9 ml
    1 ml NaOH from test tube 10
    9
    10
    9 ml
    1 ml NaOH from test tube 11
    10
    11
    9 ml
    1 ml NaOH from test tube 12
    11
    12
    9 ml
    1 ml NaOH from test tube 13
    12
    13
    -
    10 ml of 0.1 M NaOH
    13
  4. Three drops of purple cabbage extract was added to the test tube set A and three drop of purple flower extract was added into test tube set B
  5. The pH was observed by compared with the colour of both indicator change


Testing the pH of household chemicals 

  1. All the household chemicals placed into white tile
  2. Each one type of household chemicals are test with purple cabbage and purple flower extract.
  3. The colour changes was recorded and the pH value had been compared with the indicator from above procedure.

RESULT 
Testing the pH range of the indicator 

Purple cabbage extract 


    Purple flower extract 


    Testing the pH of household chemicals 

    Household Chemicals
    pH  Purple Cabbage
    pH Flower
    Toothpaste (Colgate)
    11
    11
    Detergents  (Attack Perfume)
    11
    12
    Soap (Mareah)
    6
    6
    Conditioner (Sunsilk)
    3
    4
    Soap (Shurah)
    7
    7


    DISCUSSION

    In this experiment, we were doing the pH indicator. A pH indicator is a substance which has one colour when added to an acidic solution and a different colour when added to an alkaline solution. In this experiment, were using natural substances such as red cabbage and boungainvillea.

    Red cabbage is useful as a pH indicator because the leaves contain a pigment molecule from the family of anthocyanins (shown below) which are responsible for many of the red/purple/blue colors observed in fruits and vegetables. In neutral solutions, the color observed is purple. As the solution becomes more acidic a red color results. Increasing the pH in basic solutions changes the color from blue to green and at high pH the solution is observed as greenish-yellow.

    We were instructed to bring any five chemical household to detect either daily product we use is acidic or basic. We brought Colgate, Attack Perfume (clothes washing soap), Mareah (body washing soap), sunsik (conditioner) and lastly Syurah (face washing soap). All of those product will be placed in a white tile and the natural indicator (the cabbage and boungainvillea indicator) will be mixed to see the colour changes. The colour changes will be compared with the known pH of the natural indicator that we do earlier.

    For the red cabbage indicator, the pH of the Colgate is 11 when it is compared with the indicator that we have made earlier. The same thing goes to the clothes washing soap. The pH that we got is 11 which mean that it has basic properties. For the body washing soap, the pH that we got after making comparison with the natural pH indicator is 6 which mean that it is acidic. The face washing soap show the pH 7 which is natural. It is neither basic nor acidic. Among all of the household chemical that we bring, Sunsilk is the only one that shows a very strong acid content in it.

    For the boungainvillea indicator, the pH of the Colgate is 11 which is the same as the pH in the red cabbage indicator.  The clothes washing soap shows a little bit different in value. In bouigainvillea indicator, it shows pH 12, whereas in red cabbage indicator, it shows pH of 11. For the body washing soap, the pH for both substances is the same that is 6. Sunsilk also shows a little bit different in value. In red cabbage indicator, the pH value that we get is 3, meanwhile when mixed with the bouigainvillea indicator, the pH is 4. Lastly, the face washing soap, it shows the same pH that is natural or pH 7.

    CONCLUSION

    From this experiment we can conclude that both red cabbage and flower are best natural indicator to refer to since the value of pH obtained are almost the same when tested with household solution. Both indicator able to indicate basic, acidic and neutral pH when tested with different household products.

    REFERENCES

    Anonymous. (2012). Red Cabbage Juice: A Homemade pH Indicator. Access from http://www.carolina.com/teacher-resources/Interactive/red-cabbage-guice-homemade -ph-indicator/tr10851.tr  on March 23rd, 2017.

    Helmenstine, A. M. (2013). Red Cabbage pH Indicator . Access from http://chemistry.about.com/od/acidsbase1/a/red-cabbage-ph-indicator.htm  on March 23rd, 2017.

    Katherine J. Denniston, Joseph J. Topping, Kim R. Woodrun, Robert L. Caret.(2013). General, Organic and Biochemistry.  United State of America: McGraw-Hill Education

    Martin S. Silberberg (2013). Chemistry: The Molecular Nature of Matter and Change. NewYork: McGraw-Hill Companies Inc.

    Zumdahl, Steven S. (2009). Chemical Principles (6th ed.). New York: Houghton Mifflin Company


    REFLECTION MAKING pH INDICATOR

    REFLECTION MAKING pH INDICATOR

    MUHAMMAD FARIS BIN ISMAIL SAZEMI      D20141067089

    From this experiment, it is a very interesting experiment to be conducted in practical class. By doing this experiment, I know the basicity or the acidity of the household substances that we use every day. For example, I knew some of the substances that I use every day is too acidic, or very alkali. So, in the future, I will try to avoid the use of the substances, as, from my previous knowledge, something that is very acidic or basic is not suitable to apply on the skin. In addition, in our practical class, there are varieties of substances that we tested. So, besides the things that my own group used, there are another substances that our group do not covered but done by the other groups. Lastly, I have a very wonderful teammates. They are easy to co-operate, I am very happy to work with them. All in all, everything is fine.
    Thank you.

    MAYURIE PHUTHARANT A/P SURIN    D20141067078

    During this project, I am glad that our group was still able to keep up with the schedules given and complete the task in appropriate time.  Cooperation is important in every group works and I believed that all members of my group have shown their most cooperation. We divided our workloads by bringing different type of household products that will be used in this experiment such as shampoo, cleanser, hair conditioner and so on.
    Good interpersonal relationship between the group members enables us to communicate effectively and hence working efficiently within the group. On top of that, working in a team would also need qualities such as responsibilities, disciplines, empathy and corporations. And I can assure that all my teammate have shown such qualities throughout the project. In order to produce a proper laboratory report, we divided our work loads into parts such as introduction, results, discussion, conclusion and so on. Hence, it is easier for us to compile it together later. Our group was able to work closely and had constant communications on online WhatsApp after class in order to finish our task.


    NUR AFIQAH SYAHMINA BT MOHD KAMAL            D20141067091

    Assalamualaikum and hello everyone, for this week we are doing the lab project for Application: Making pH indicator. In this lab we are gone make our own pH indicator to test the pH range of the indicator and also to test the household chemical. For this experiment all of group need to bring flower and 5 type of household. First is we need to extracting the indicator, we use two different indicator which is purple cabbage and purple flower. After that the extracts from the two indicator have been used to test the pH range for each indicator. Last but not least, we use the indicator to test the pH of household chemical. The household that we bring is toothpaste (Colgate), detergents (Attack Perfume), soap (Mareah), conditioner (Sunsilk) and soap (Shurah). This experiment help us to know the pH of each product that we use. For the example is the conditioner that I use, the pH is 3 (purple cabbage) and 4 (purple flower). This show that the product is really acidic and I did not know before this which is really dangerous for my hair. This experiment really help me to know which product is suitable to be use and which one are not suitable to been used for ours daily day.
    Thank you.


    Thursday 16 March 2017

    ACID- BASE TITRATION


    DEPARTMENT OF BIOLOGY

    FACULTY OF SCIENCE & MATHEMATICS
    UNIVERSITI PENDIDIKAN SULTAN IDRIS

    SBK3013
    PRINCIPLE IN BIOCHEMISTRY

    EXPERIMENT 1: ACID BASE TITRATION


    NAME
    MATRIC NO.
    MUHAMMAD FARIS BIN ISMAIL SAZEMI
    D20141067089
    MAYURIE PHUTHARANT A/P SURIN
    D20141067078
    NUR AFIQAH SYAHMINA BT MOHD KAMAL
    D20141067091

    GROUP: A
    LECTURER’S NAME: DR. ROSMILAH MISNAN
    INSTRUCTOR: NUR ATIEKAH BT AZAHARI
    DATE AND TIME: 17 MARCH 2017


     INTRODUCTION
               
    An acid-base titration is a neutralization reaction that is performed in the lab in the purpose of to determine an unknown concentration of acid or base. The general purpose of a titration is to determine the amount of particular substance in a sample. Weak acid is different from strong acid as it cannot dissociate completely in the water. Due to this, H+ concentration in weak acid depends on the coefficient of equilibrium. When a weak acid is titrated with a strong base, or weak base is titrated with a strong acid, the titration curve is unique for the weak acid or the weak base. Hence, a titration curve can be used to determine the ionization constants for weak acids and weak bases.
                    The pH value can be measure by using the solution into the pH meter and after every drop of NaOH into the solution the value of pH is taken. The higher the concentration of H+, the lower the pH value.


    MATERIAL


    0.1 M Acetic acid


    0.1 M Phosporic acid


    PROCEDURE


    (1) 0.1M NaOH is filled into a burette

    (2) 25 mL of acetic acid is titrated with NaOH


    (3) The pH is measured for every 1 mL of NaOH added to the acid


    (4) The result is recorded as in the table below

    (5) Experiment is then repeated with 0.1M of phosphoric acid


    RESULT

    1) Titration of Acetic Acid

    Volume of NaOH used (mL)
    pH
    Initial
    3.10
    1.0
    4.37
    2.0
    5.01
    3.0
    5.58
    4.0
    12.33


    Graph of pH versus volume of base for acetic acid titration


    2) Titration of Phosphoric Acid

    Volume of NaOH used (mL)
    pH
    Initial
    1.64
    1.0
    1.98
    2.0
    2.72
    3.0
    6.66
    4.0
    7.58
    5.0
    11.11
    6.0
    12.40
    7.0
    12.79
    8.0
    13.18
    9.0
    13.40
    10.0
    13.52
    11.0
    13.60
    12.0
    13.68
    13.0
    13.76
    14.0
    13.78
    15.0
    13.80
    16.0
    13.86
    17.0
    13.87
    18.0
    13.89
    19.0
    13.90
    20.0
    13.93
    21.0
    13.97
    22.0
    13.98
    23.0
    13.99
    24.0
    14.00


    Graph of pH versus volume of base for phosphoric acid titration


    DISCUSSION

    Titration of Acetic acid

    The graph of titration of acetic acid is shown above. Acetic acid is monoprotic acid which can donate only one hydrogen atom per molecule. At the first point of the curve, it only shows the solution of acetic acid only. The pH value at the point is the pH for pure acetic acid. When some volume solution of NaOH is added, hence acetate ion is produced. The curve will rise and show a slight linear. The solution will now contain both acid and its conjugate base which is the acetate ion. Acetate ion will act as a buffer that resist the change in pH value upon dilution or addition of both acid and base.
    HC2H3O2 + OH- à  C2H3O2- + H2O
    At point of addition 1 mL of NaOH, it indicates the initial point .The pH of the point midway is equal to the pKa for acetic acid which is 4.76 approximately. The buffer zone is the middle part of the curve which is flat and the addition of any base or acid will not affect the pH of the solution drastically. The value of buffer zone is between 3.76 to the 5.76. At equivalence point (addition 4 mL of NaOH), all acetic acid is being neutralized and only some acetic ion will be present in the solution.

    Titration of Phosphoric acid

    The graph of titration of phosphoric acid is shown above. Phosphoric acid is polyprotic acid that can donate more than one hydrogen atoms per molecule. The first point on the curve showed the solution of phosphoric acid only. The pH value at this point is the pH for pure phosphoric acid. When some NaOH is added, H2PO4- is produced. The solution now contains acid and its conjugate base (dihydrogen phosphate). This conjugate base acts as a buffer which resists the change in pH upon dilution or addition of both acid and base.
    At point of addition 1mL NaOH it indicates the initial point. At the first flat curve of the graph which is indicate as the first buffer zone. The first pKa for phosphoric acid is 2.15 at the point midway on the first flat curve. The buffer zone is between pH 1.15 to 3.15. At the 1st equivalence point, all H3PO4 is being neutralized and only some H2PO4- is present in the solution.
    When more NaOH is added, HPO4 2- is produced. The solution now contains acid and its conjugate base (hydrogen phosphate- as buffer). At the second flat curve part of the graph indicate as 2nd buffer zone. The value of second buffer zone is between pH 6.2 to 8.2.  The pH of the point midway between the flat curves equals to pKa2, which is 7.20. At the 2nd equivalence point, only HPO4 2- is present in the solution.
    When more NaOH is added further, PO4 3- is produced. The solution now contains acid and its conjugate base (phosphate ion- as buffer). The third flat curve part of the graph is called as 3rd buffer zone. The pH of the point midway between the flat curves equals to pKa3, which is 12.35. The buffer zone is range between pH 11.35 to 13.35. At the 3rd equivalence point, only PO4 3- and excess unreacted OH- are present in the solution.
    The determining of pKa is by looking at the pH at the half-titration point which equal to the pKa of the weak acid. The pKa value also indicates the inflection point for the acid. Near to this point, the pH changes detected is little with the addition of the base.
    The graph is different for each acid because acetic acid are monoprotic acid which have only one pKa value which is 4.76. On the other hand, phosphoric acid are polyprotic acid which indicate three pKa values which are 2.15, 7.20 and 12.35 respectively.

    CONCLUSION
    The pKa value that we get from the experiment is not much different to the value of the pKa that state for the acetic acid and phosphoric acid.

    REFERENCES

    Perrin, D. D., Dempsey, B., & Serjeant, E. P. (1981). pKa prediction for organic acids and 

               bases (Vol. 1). London; New York: Chapman and Hall.

    Goldman, J. A., & Meites, L. (1964). Theory of titration curves: Locations of points at which 

               ph= pka on potentiometric acid-base titration curves; end-point errors in titrations to 
               predetermined ph values. Analytica Chimica Acta30, 28-33.


    PROTIEN (AMENDED)

    DEPARTMENT OF BIOLOGY FACULTY OF SCIENCE & MATHEMATICS UNIVERSITI PENDIDIKAN SULTAN IDRIS SBK3013 PRINCIPLE IN BIOC...